API
Logs
Learn how to review request statistics and request logs for an API integration in the Blazelock dashboard.
The Logs section shows how an API integration is being used and how individual requests were handled. This allows you to monitor request volume and investigate errors or slow requests.
Logs overview
Open your API integration in the dashboard and select the Logs section on the detail page.
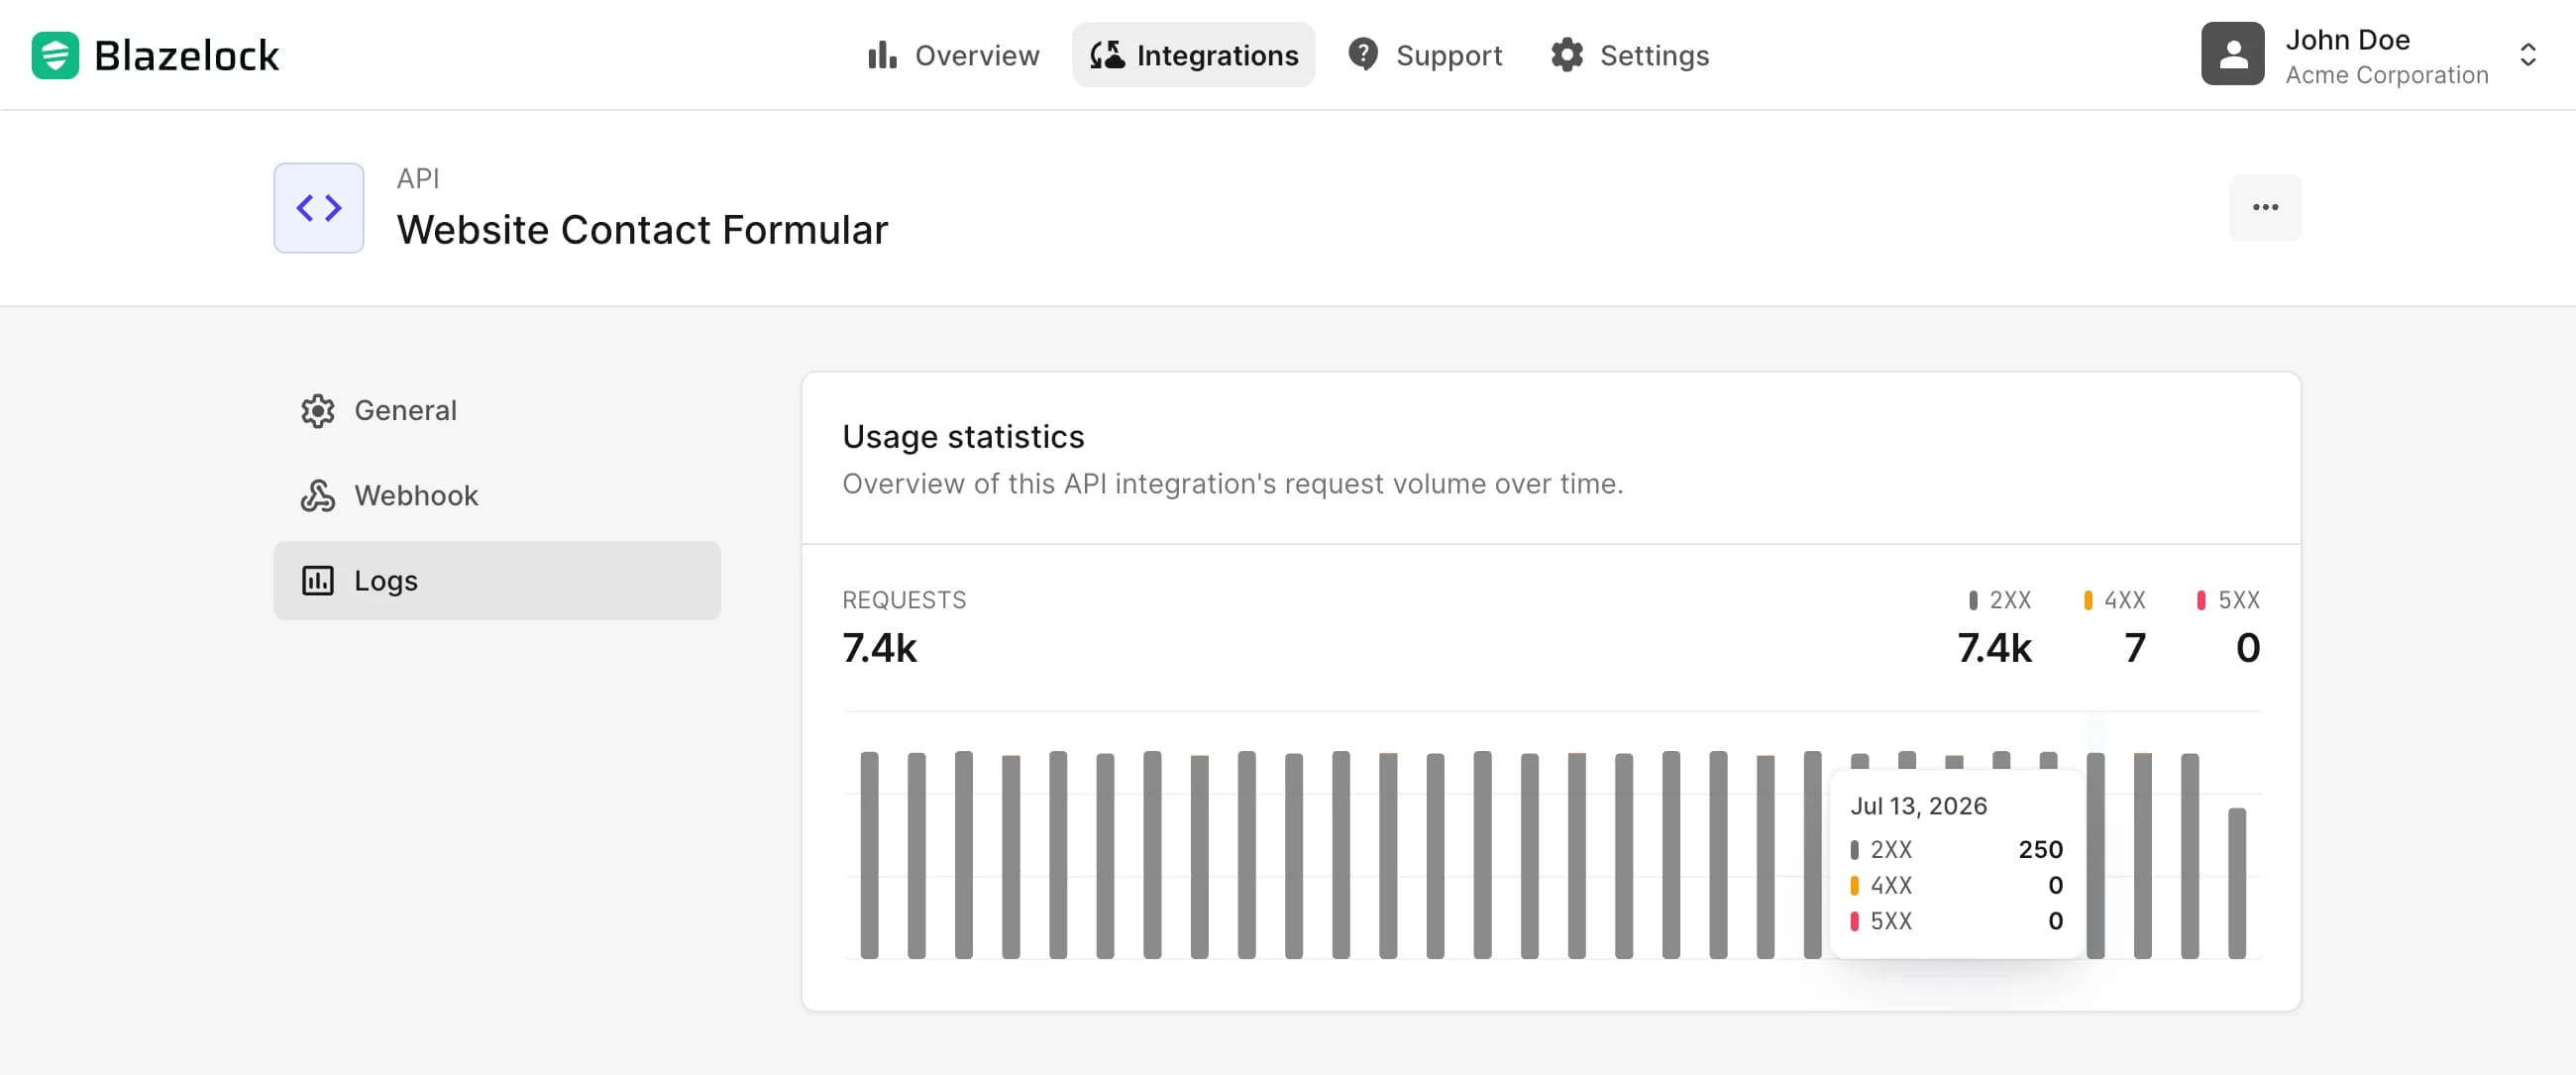
The Usage statistics card summarizes requests from the last 30 days. The chart groups requests into daily intervals and displays:
- Requests: The total number of requests
- 2XX: Successful responses
- 4XX: Responses caused by an error in the request
- 5XX: Responses caused by an error while processing the request
Review API requests
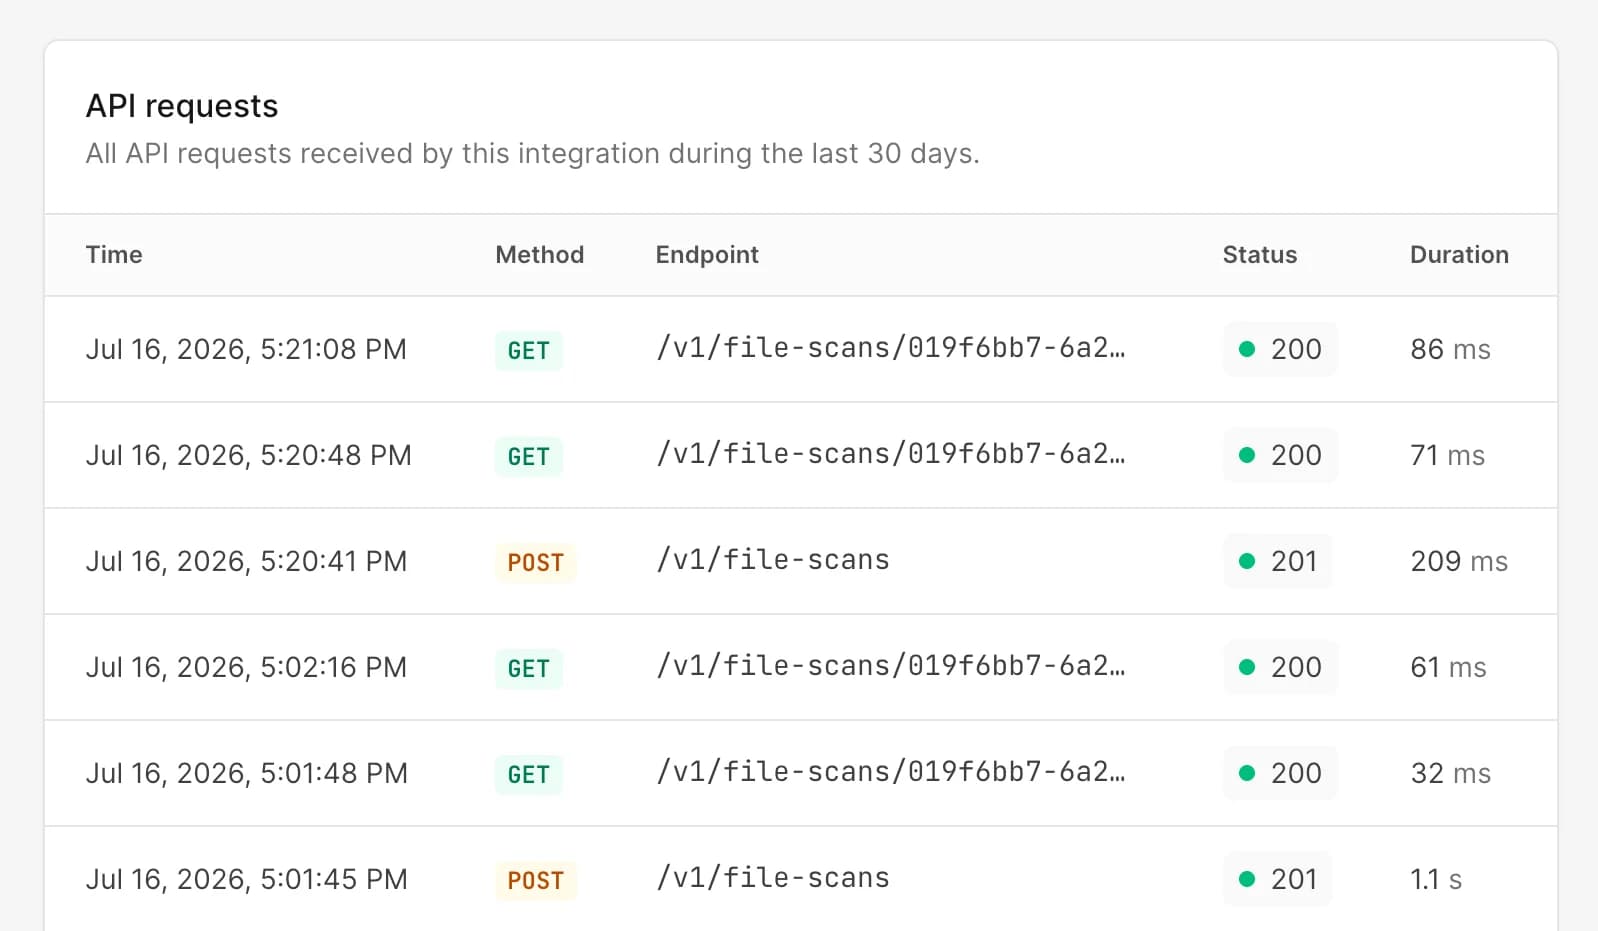
The API requests table lists requests from the last 30 days. Each row contains:
| Field | Meaning |
|---|---|
| Time | When Blazelock received the request |
| Method | The HTTP method, such as GET or POST |
| Endpoint | The requested API endpoint |
| Status | The HTTP response status returned by Blazelock |
| Duration | The time Blazelock needed to handle the request |
The log contains request metadata only. Request bodies, uploaded files, response bodies, and authentication credentials are not displayed.